Quickstart
Set the date variable for the OPERA 48h feed (used in all examples below):
mydate=$(date -d yesterday +%Y%m%d)
sta=${mydate}T080000
end=${mydate}T090000
List Available Radars
List radars near a country to be used for estimation. The --buffer option expands the search area (default: 10km). Use --buffer 0 for exact border distances. The --distance option sets the radar coverage radius for filtering (default: 150km).
# list radars near Belgium
naaulu list --country bel
# with custom buffer and coverage radius
naaulu list --country bel --buffer 100km --distance 200km
# exact distance to border, foreign radar excluded
naaulu list --country bel --buffer 0 --distance 0
Estimate Rainfall
Compute rainfall estimations from radar data at base resolution (5min, 1km). Define the country code (e.g., bel), and product method (i.e., dove or eider).
Note: This should take a few minutes.
naaulu estimate \
  --first $sta \
  --last $end \
  --country bel \
  --product eider
Combine Into Final Products
Combine the computed high resolution estimates over a specific duration and resolution:
naaulu combine \
  --first $end \
  --country bel \
  --duration pt1h \
  --resolution 2km \
  --product eider
Generate Plots & Visualization
Render a high-quality spatial plot of the combined rainfall accumulation:
naaulu plot \
  --first $end \
  --country bel \
  --duration pt1h \
  --resolution 2km \
  --product eider \
  --network bel \
  --show
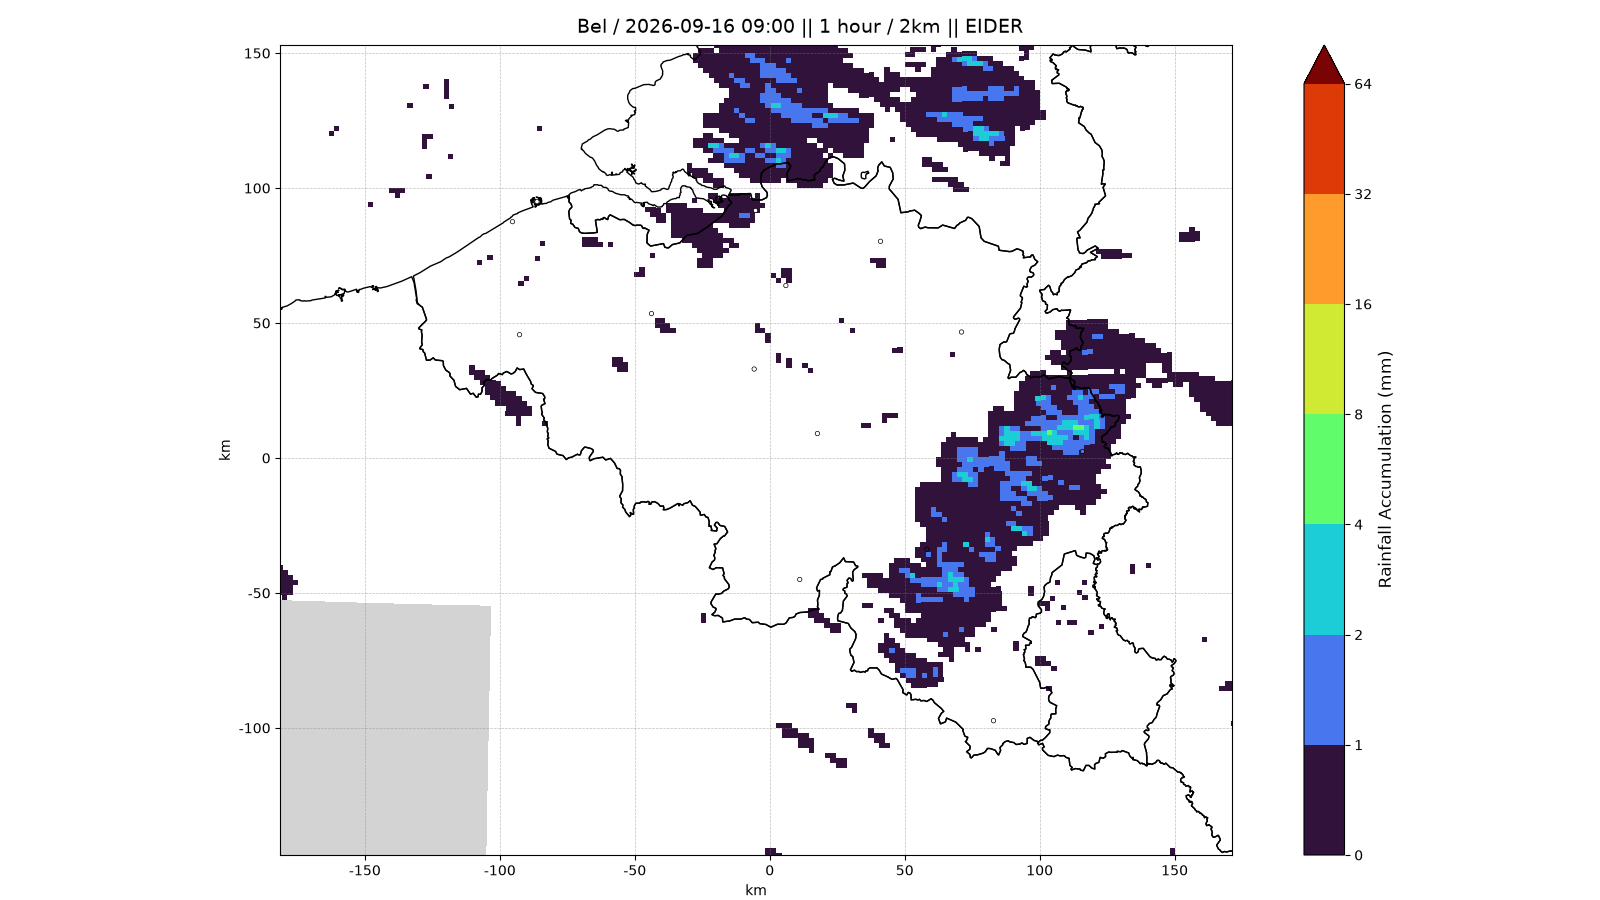
Note: The small grey zone corresponds to an estimation tile not covering the area of interest.
Verify Against Gauges
Validate the rainfall estimates against rain gauge observations and display the scatter plot with error metrics:
Note: Pairs with both values below 0.1mm are discarded.
naaulu verify \
  --first $end \
  --country bel \
  --duration pt1h \
  --resolution 2km \
  --product eider \
  --network bel \
  --show
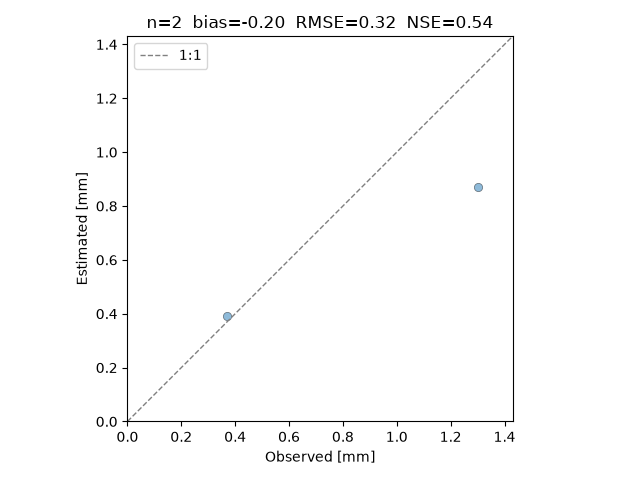
Note: Due to a much coarser resolution, the estimated values tend to be lower than the observed values, for higher values.